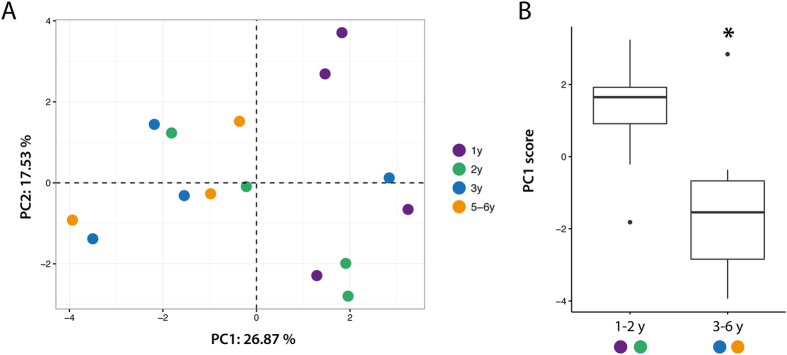
Figure 8. Multivariate analysis highlights aged-dependent pathology.
(A) Principal component (PC) analysis was applied on 18 parameters measured for each animal (n = 15). Each animal is represented as a colored dot in the new space created by PC1–2. (B) Boxplot represent mean PC1 score of 1–2 years-old compared to 3–6 years-old animals. *p < 0.05 Two sample t-test.

