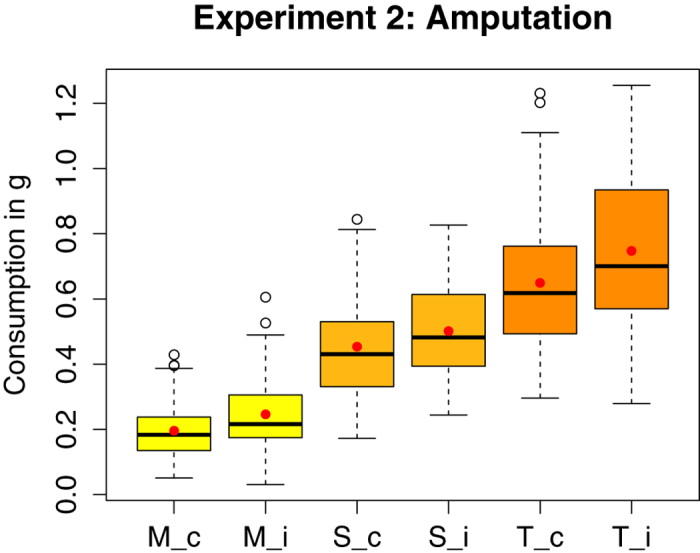
Figure 3. Absolute consumption (in g, per bee, over four days) of morphine solution (M), pure sucrose solution (S) and both solutions combined (total consumption: T) for the control (c) (n = 54) and the injured (i) (n = 52) group of Experiment 2 (n = number of cages).

Mean and median values are represented by red dots and horizontal black lines, respectively. The amputated bees ingested significantly more morphine than their controls and also drank significantly more solution in total. There was no significant difference in sucrose consumption between the two groups (see Supplementary Table S2).
