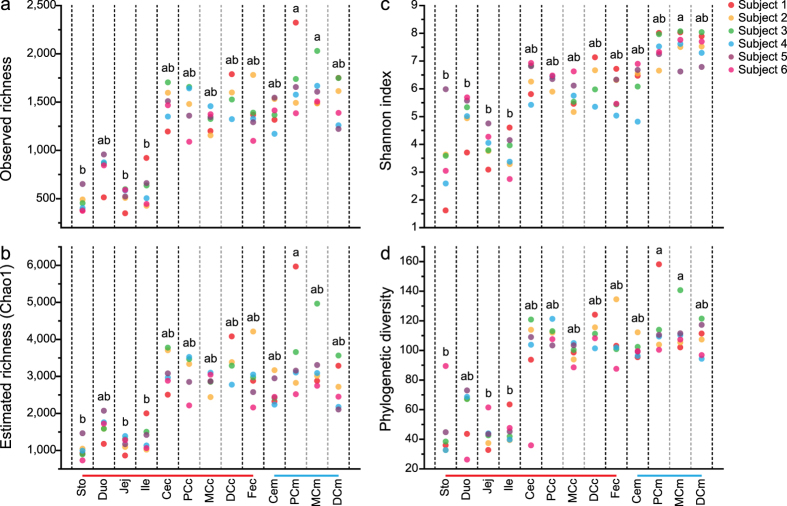
Figure 1. Diversity measurements for each sample.
(a) Observed richness, (b) estimated richness, (c) Shannon index and (d) phylogenetic diversity measurements at each anatomic site from the 6 rats, where each point represents a sample. Ten iterations of rarefied subsets of 22,880 sequences from each sample were used to calculate the average values for these metrics. Different letters (a,b) above the points mean significant differences between sampling sites (Nemenyi’s post hoc multiple comparison test, FDR < 0.05). Sto: gastric contents; Duo: duodenal contents; Jej: jejunal contents; Ile: ileal contents; Cec: cecal contents; PCc: proximal colonic contents; MCc: middle colonic contents DCc: distal colonic contents; Fec: feces; Cem: cecal mucus; PCm: proximal colonic mucus; MCm: middle colonic mucus; DCm: distal colonic mucus. The red bar at the bottom of the graphs is used to highlight luminal samples, and the blue line highlights mucosal samples.

