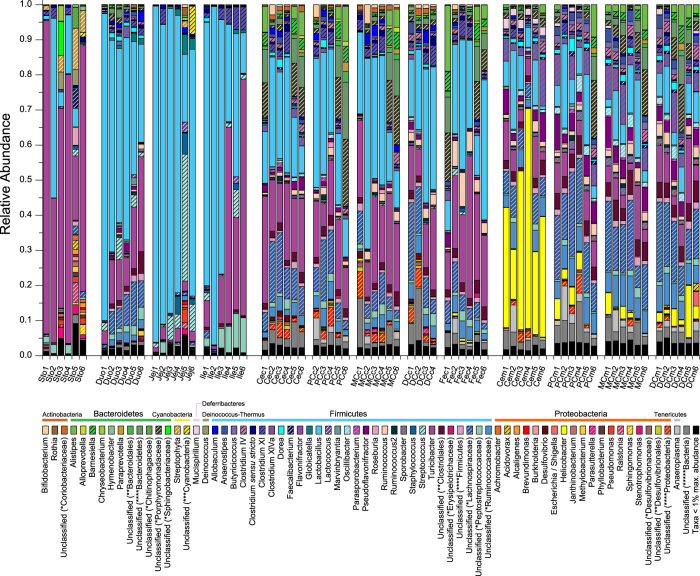
Figure 2. Longitudinal and transverse distribution of dominant taxonomic groups at the genus level.
The relative abundance of different genera was adjusted by the 16S rRNA copy number data. Sample ID abbreviations are in line with those used in Fig. 1. The number following the abbreviations stands for the subject number. For example, Sto1, Sto2, Sto3, Sto4, Sto5, and Sto6 stand for the gastric contents from the 1st, 2nd, 3rd, 4th, 5th and 6th rat. Unclassified genera under a higher rank are marked by asterisks (*family; **order; ***class; ****phylum; *****kingdom). A complete list of adjusted counts for each genus grouped by sample is presented in supplemental Table S3.

