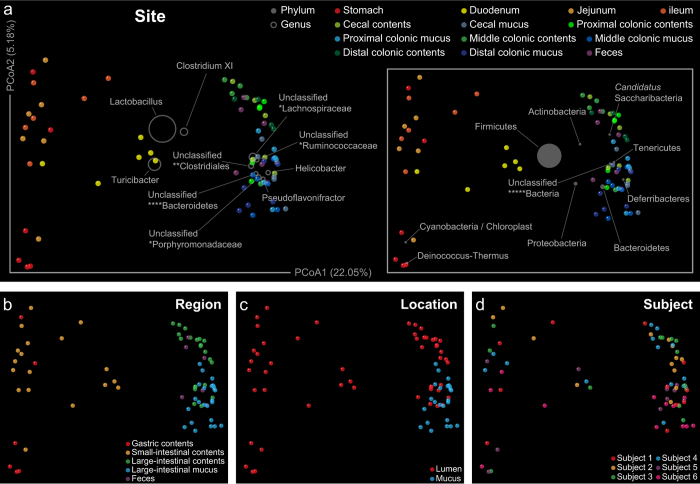
Figure 3. Stratification of the microbial community membership driven by different categorical factors and taxonomic groups.
Principal coordinates analysis of unweighted UniFrac distances between samples from rat digestive tract (performed on all OTUs), grouped by sampling (a) site (adonis: R2 = 0.37; P ≤ 0.001), (b) region (adonis: R2 = 0.28; P ≤ 0.001), (c) location (adonis: R2 = 0.08; P ≤ 0.001) and (d) subject (adonis: R2 = 0.09; P = 0.02). The percent of variation explained by each coordinate is indicated in parentheses. The contribution of different taxonomic groups is represented by the size of the circles (grey) overlaid onto the PCoA based on phylogenetic information. Unclassified genera under a higher rank are marked as in Fig. 2.

