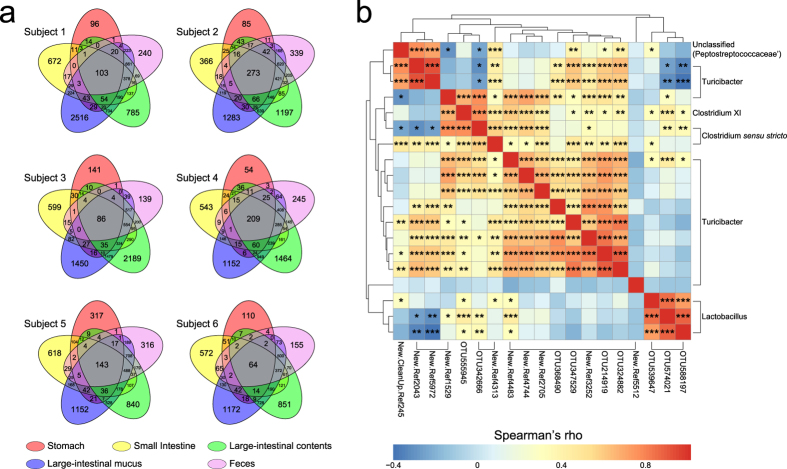
Figure 5. OTU overlap across sampling regions.
(a) Venn diagrams demonstrating 97% OTU cluster overlap within subjects. Numbers correspond to unique OTU clusters within a subset. To highlight shared OTUs, singleton clusters were removed before analysis. (b) Correlation matrix showing the Spearman’s rank correlation amongst the 19 core OTUs shared across all subjects. The correlations were controlled for multiple testing by false discovery rate (*FDR < 0.05, **FDR < 0.01 and ***FDR < 0.001).

