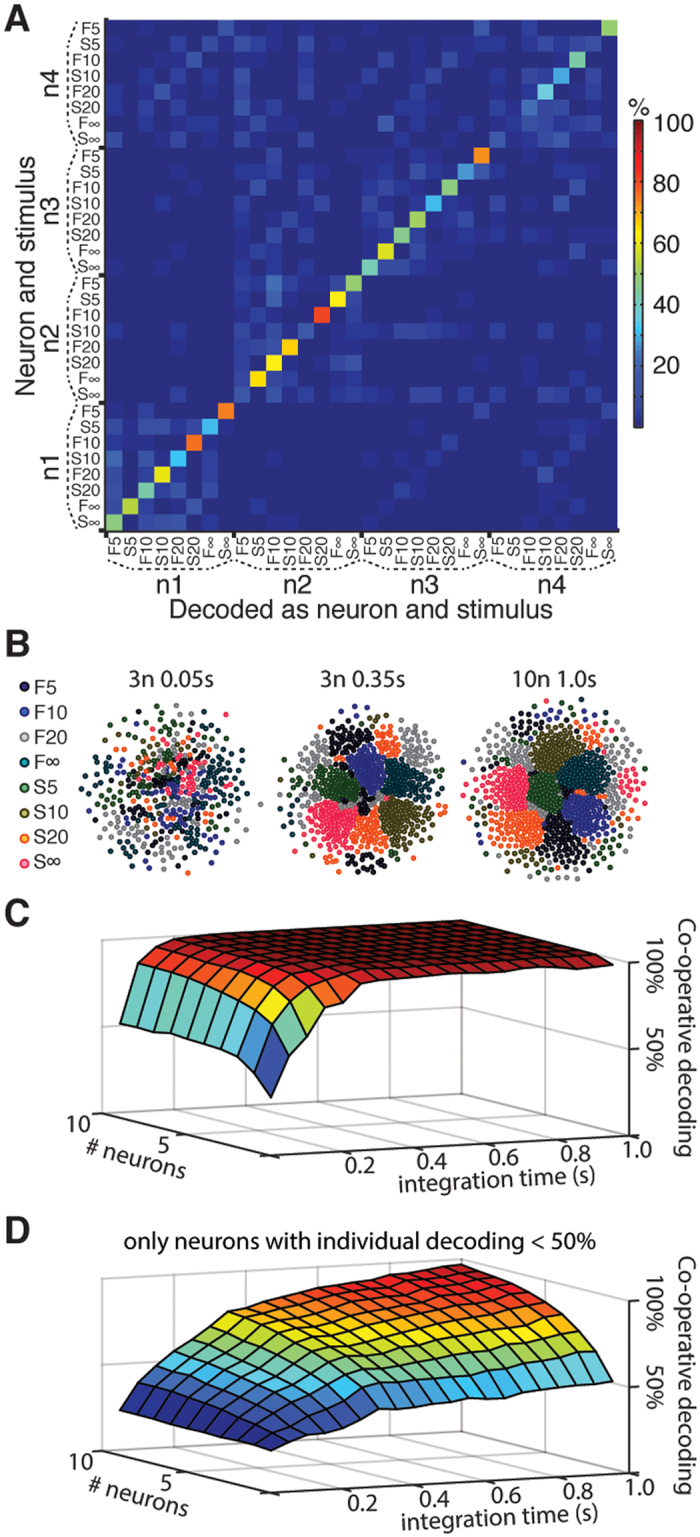
Figure 6. Potential for co-operative decoding in limited neuronal populations.

(A) Confusion matrix for four high performing neurons, where the temporal patterns of the spike responses to the different stimulation patterns were specific to the neuron. (B) The cluster plots show the results of the curvilinear component analysis of the unlabelled spike responses, illustrating the segregation of individual stimulus presentations for the two optimal (with respect to co-operative decoding rate) neurons at 50 ms, the 5 optimal neurons at 350 ms, and the 10 optimal neurons at 1000 ms. The stimulation pattern is color coded as in Fig. 2B. (C) 3D plot to illustrate the evolution of the estimated optimal population decoding rate, as evaluated with PCA and kNN, from the repeated presentations of the stimulation patterns and an increasing number of neurons and increasing time. (D) The estimated optimal population decoding when the pool of neurons was limited to those with a mean decoding below 5 times chance level.
