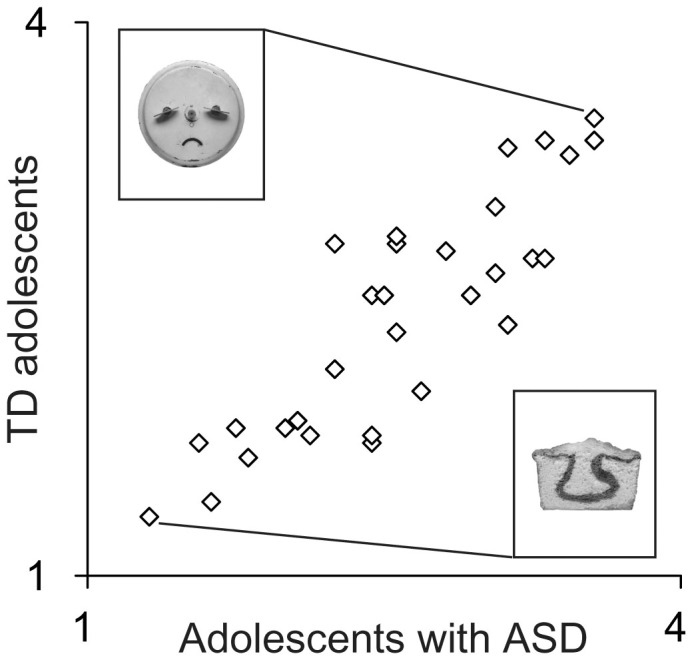
Figure 1. The average face-likeness score for each of the objects in the evaluative rating experiment (Experiment 1).

Each dot indicates the mean face-likeness score for each of the objects rated by the adolescents with ASD and the TD adolescents. The object in the top left of the figure was the one given the highest face-likeness rating score. The object in the bottom right of the figure was the one given the lowest score. ASD, autism spectrum disorder; TD, typically developing. Images: from FACES by Francois Robert and Jean Robert. © 2000 by Francois Robert. Used with permission of the authors and Chronicle Books LLC, San Francisco.
