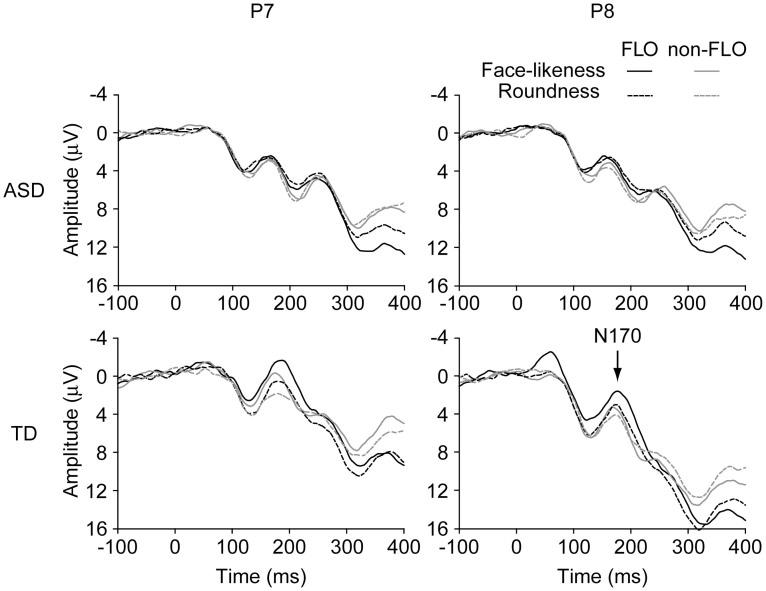
Figure 2. Grand average ERP waveforms.
This figure depicts the grand average ERP waveforms of the adolescents with ASD (top two panels) and the TD adolescents (bottom two panels) in response to the FLOs (black lines) and the non-FLOs (grey lines) at P7 (left panels; left occipitotemporal region) and P8 (right panels; right occipitotemporal region) during the face-likeness (solid lines) and roundness judgement (dashed lines). ERP, event-related potential; ASD, autism spectrum disorder; TD, typically developing; FLO, face-like object.

