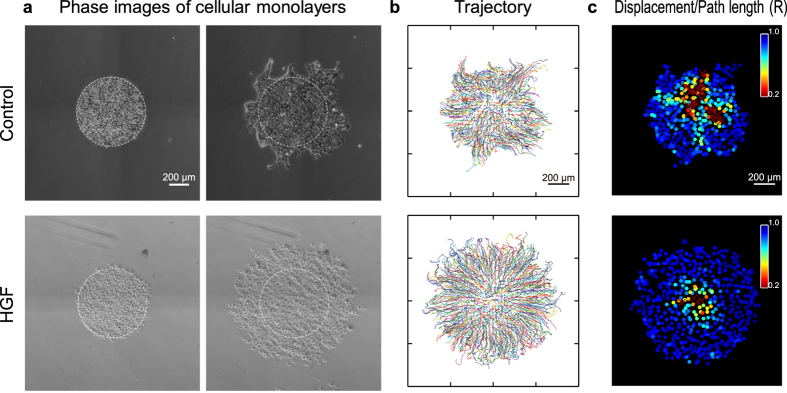
Figure 1. Expansion of MDCK cellular islands.
(a) Phase contrast image of control and HGF-treated cellular islands at 1 hour and 12 hours after removing the mask. (b) Trajectory plots of individual cells in the islands for 12 hours after removing PDMS mask. (c) Ratio of displacement to path length for control and HGF-treated samples were examined for duration of 9 to 12 hours. Cool colors indicate straighter motion than warm colors. All data sets are representative of multiple experiments.

