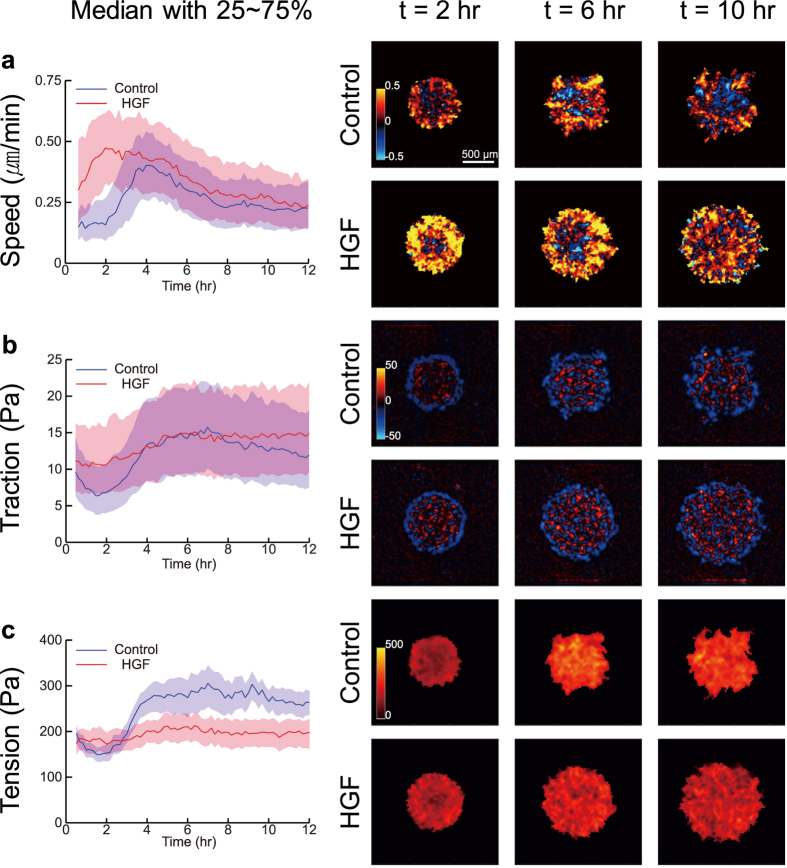
Figure 2. Distribution of speed, traction and tension in the cellular islands during the monolayer expansion.
25~75% interquartile ranges (shaded regions) and medians (solid lines) were computed for the whole cellular island and plotted over time (left panels). For spatial distribution, radial components of speed and traction and magnitudes of tension in the island measured at 2, 6, and 10 hours after removing PDMS mask were plotted in color coded maps (right panels). (a and b) As speed and traction are a 2D vector, from the center of the islands, radially inward components are shown in cool color, and radially outward components are shown in warm color. (c) Brighter indicate greater tension.

