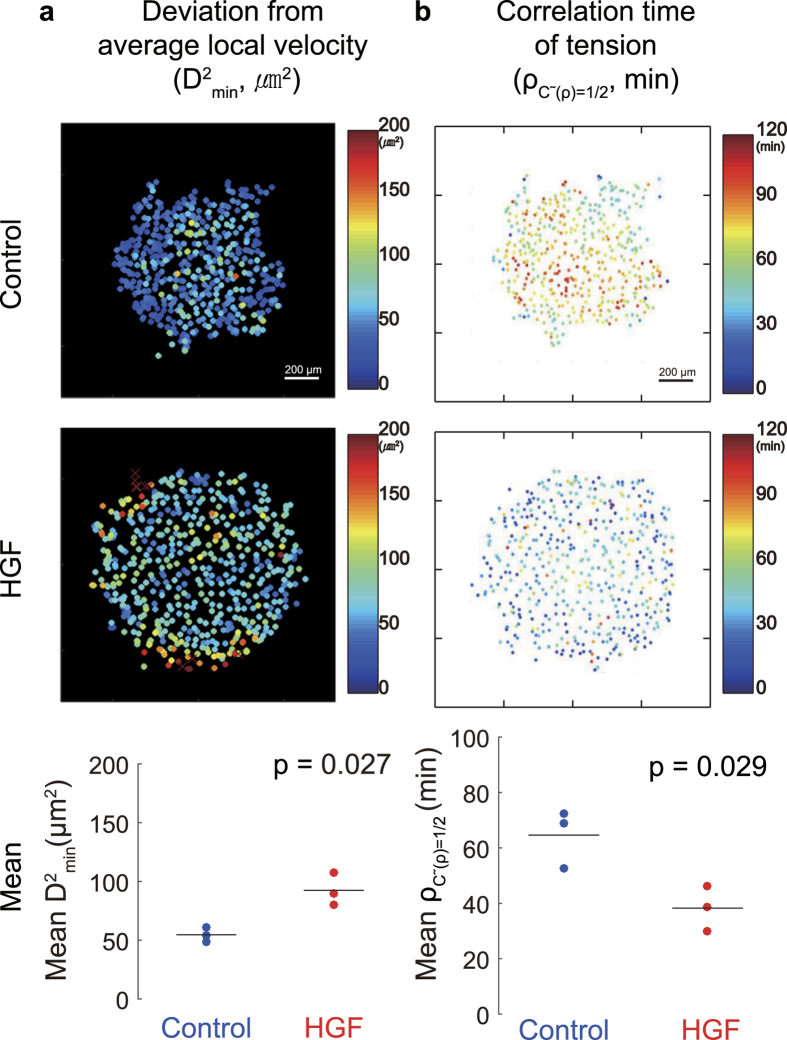
Figure 3. Cooperativity of motion and force in the cellular islands.
Spatial distribution of cooperativity was examined for duration of 9 to 12 hours in color maps (upper panels) and averaged over all cells (lower panels, n = 3). (a) Deviations in motion between each cell and its 8 nearest neighbors are quantified with D2min. Dots in cool colors indicate cooperative cellular motions, whereas dots in warm color indicate individual, non-collective motions. (b) Correlation time of tension along cell trajectories,  . Dots in cool colors signify lower persistence—and therefore greater temporal fluctuations—in tension than dots in a warm color.

