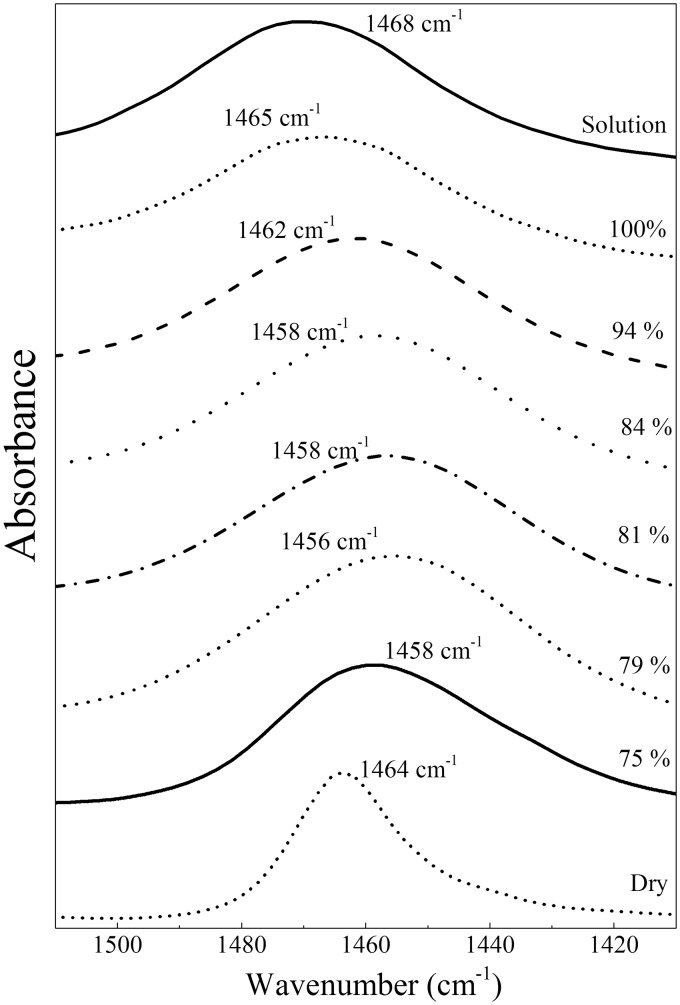
Figure 1.
Spectra of urea between 1510 and 1410 cm–1 at fixed relative humidities. The νas(CN) band peak at 1468 cm–1 in solution downshifts as relative humidity decreases to 79%, before upshifting towards the 1464 cm–1 position characteristic of dry urea at lower relative humidities (spectra are not shown to scale).

