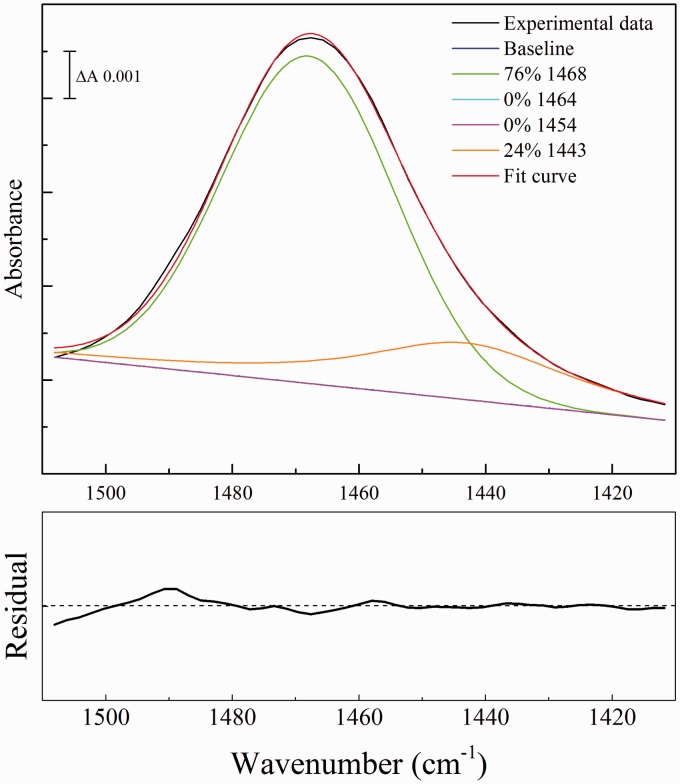
Figure 2.
Component fitting to the νas(CN) band of urea in solution. A spectrum of 200 mM urea in aqueous solution was recorded. Absorbance contributions of bulk water were first subtracted using an ATR spectrum of pure water and the 1510–1410 cm–1 region was then corrected for the effects of ramping caused by recording in ATR mode. An optimal fit was then made of intensities of the four components of fixed frequencies and bandwidths (Table 4), together with an unrestricted linear sloping baseline. Fractions of each component were calculated from the peak areas (integrated intensities). The residual for the overall fit is shown underneath at the same scale as the component fit, with the center line representing zero.

