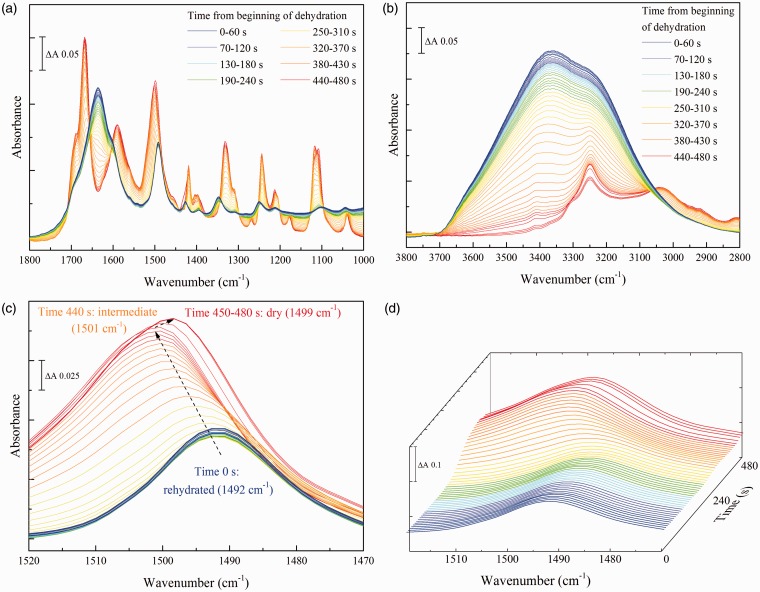
Figure 5.
Serial spectra of a rehydrated creatinine sample during drying. 3 µL of a 10 mM solution of creatinine was firstly dried onto the crystal surface and rehydrated in a water-saturated atmosphere. Spectra were then recorded during drying over a three-minute period. (a) the 1800–1000 cm–1 ‘fingerprint’ region; (b) the 3800–2800 cm–1 region. (c) and (d) two-dimensional and three-dimensional plots of the 1520–1470 cm–1 region showing the (ν(C = N) (30) ν(CN) (27) δ(NCH) (24)) band behavior. Rehydrated creatinine spectra are shown in blue and dried creatinine spectra in red.

