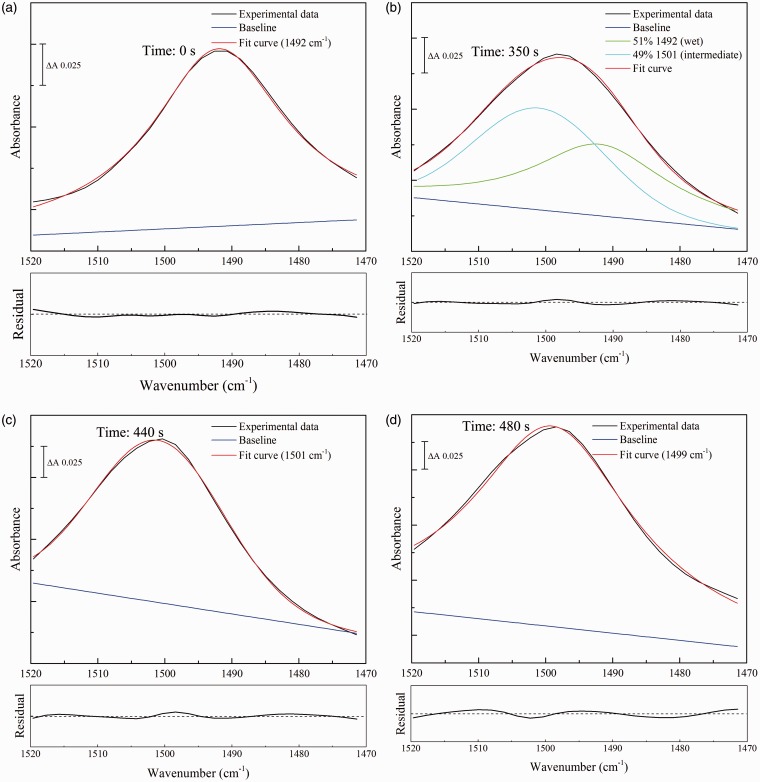
Figure 6.
Curve fitting to the 1520 and 1470 cm–1 region of the FT-IR spectrum of creatinine during the transition from rehydrated to dry states. 3 µL of a 10 mM solution of creatinine were firstly dried onto the crystal surface and then rehydrated in a water-saturated atmosphere. Four spectra were selected from the series obtained during drying of this rehydrated sample. Spectra shown were corrected for effects of ramping caused by recording in ATR recording mode, followed by optimal fitting of the intensities of the three components of fixed wavenumbers and bandwidths (Table 2), together with unrestricted linear sloping baselines. (a) rehydrated; (b) and (c) intermediate partially-hydrated; (d) dry states. The residuals for each overall fit are shown underneath each panel at the same scale as the corresponding component fit, with the center line representing zero.

