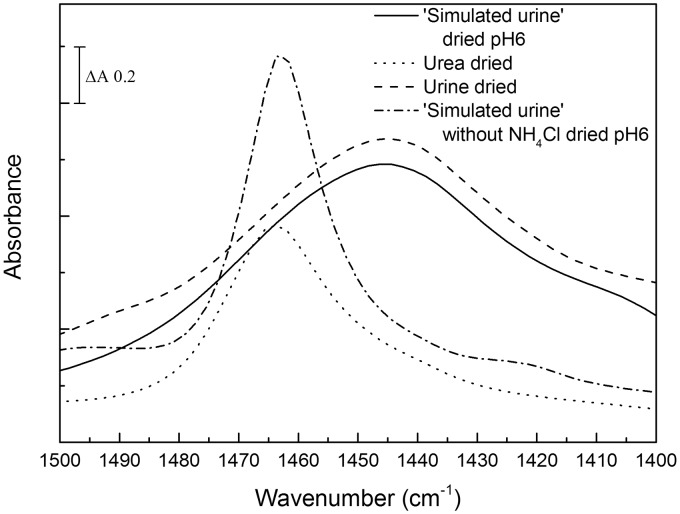
Figure 9.
Behavior of νas(CN) urea band in dried simulated urine. 3 µL of simulated urine containing 115 mM urea, 50 mM NaCl, 29 mM NH4Cl, 19 mM KH2PO4, 10 mM K2SO4 and 5 mM creatinine were dried onto the crystal surface and the spectrum was recorded after stabilization (solid line). Also shown are spectra of 3 µL 50 mM urea after drying (dotted line) and 3 µL healthy donor urine after drying (dashed).

