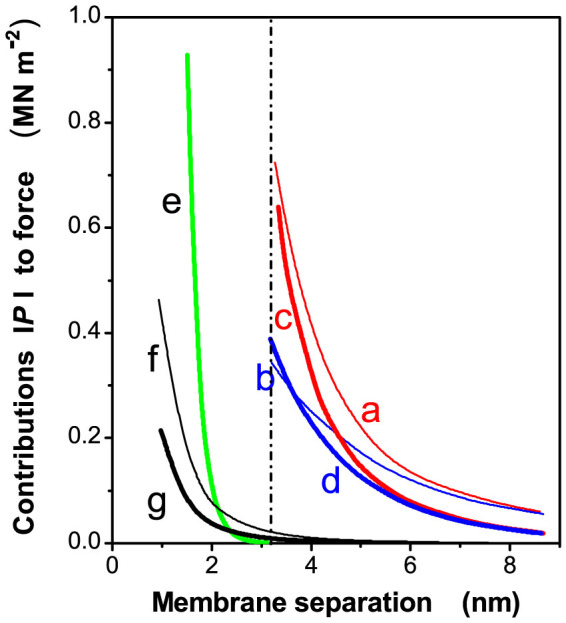
Figure 2. Theoretical calculations of the contributions, |P|, to the force between two membranes as a function of separation.

Re-plotted on a linear scale from Figure 8 of Rubin et al.21. The curves a, b, c and d represent the electrostatic repulsion in two ionic media (one stacking and the other unstacking), calculated at either constant surface charge density or constant surface potential. Curve e denotes the hydration repulsion. Curves f and g denote the van der Waals attraction, corresponding to dielectric constants of 3 and 2.5, respectively, with volume fractions of protein (Vpr) in the membrane of 0.6 and 0.4, respectively. The dashed vertical line denotes a very recent estimation of membrane separation13.
