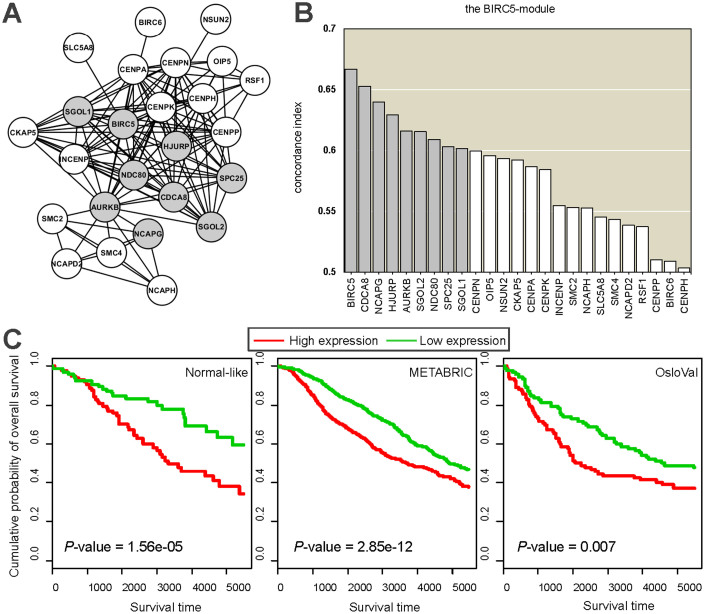
Figure 4. The BIRC5 prognostic module.
(A) The subnetwork of the 25-gene BIRC5 module. The nine genes in gray have CIs larger than 0.60. (B) The 25 genes are ranked according to their CIs. The nine genes with CIs larger than 0.60 are marked in gray (C) Kaplan-Meier cumulative survival curves of two breast cancer groups based on the expression of the BIRC5 module over a 15-year period on the normal-like tumor dataset, the METABRIC whole dataset and the OsloVal dataset respectively. The two patient groups in each plot were defined by partitioning the patients into two equal-sized sets using the median value of the averaged gene expression profile of the BIRC5 module.

