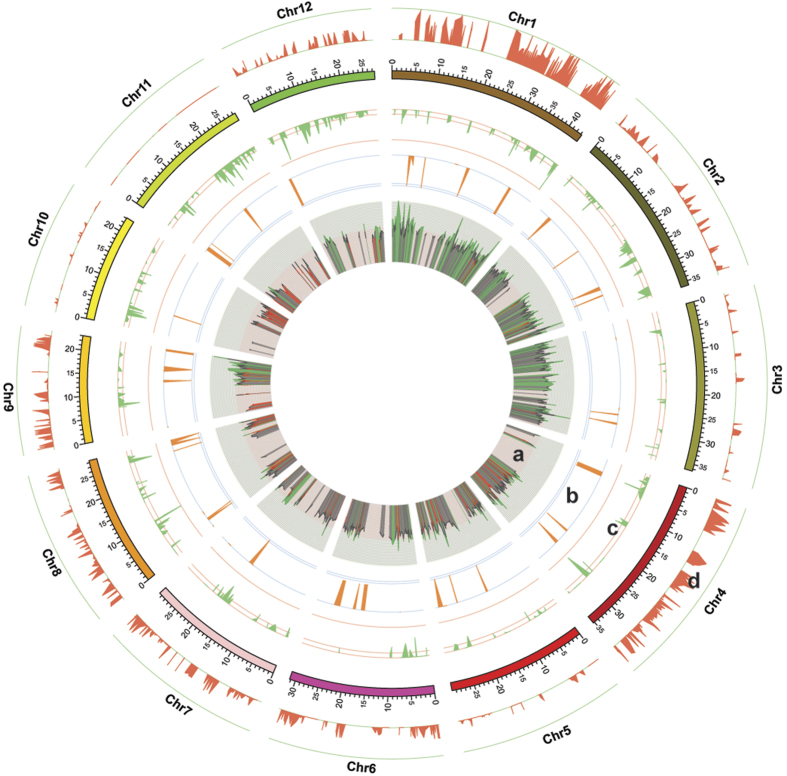
Figure 4. Summary of the genetic architecture of the Huanghuazhan rice (Oryza sativa) pedigree.
(a) The inner circle represents the proportions of functional gene clones per 10 kb on 12 chromosomes (ranging from 0 to 1, where peak height indicates cloned gene abundance). (b) The second orange circle depicts proportions of QTL blocks from the association study on data collected in 2012 and 2013 per 1 Mb (ranging from 0 to 1, where peak height indicates cloned gene abundance; the three green lines are the axis, 1st quarter, and 2nd quarter values from the outer layer to the inner layer; the inner most line has a value of 1). (c) The third green circle represents the proportions of HTBs per 100 kb over 12 chromosomes (ranging from 0 to 1; the three green lines are the axis, 1st quarter, and 2nd quarter values from the outer layer to the inner layer; the inner most line has a value of 1). (d) The fourth red circle represents the proportions of SSWs per 50 kb over 12 chromosomes (ranging from 0 to 1; the four green lines are the axis, 1st quarter, 2nd quarter, and maximum values from the inner layer to the outer layer; the outer most line has a value of 1).

