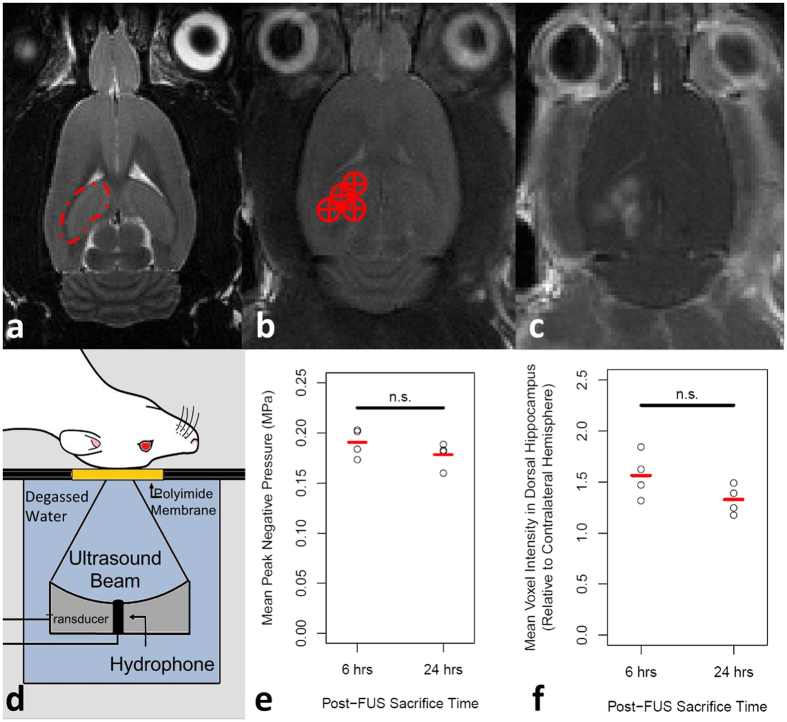
Figure 1. MRIgFUS.
(a) The dorsal hippocampus (indicated by red dotted line) was (b) targeted from T2-weighted images (targets indicated by red circle with cross). (d) For sonication, the rat is positioned supine on an MRI compatible sled with the top of the skull coupled to a polyimide membrane. The bottom of the membrane was coupled to a tank filled with degassed, deionized water, housing the transducer/hydrophone assembly. The FUS procedure was applied as described in the methods section. (e) Mean peak negative pressure in the dorsal hippocampus following a software-triggered pressure drop were 0.19 MPa ± 0.02 MPa and 0.18 MPa ± 0.02 MPa (p = 0.246; unpaired, two-tailed, student’s t-test) for the 6 and 24 hrs post-FUS groups, respectively. Following FUS, (c) T1-weighted MR images were taken to confirm BBB permeability was increased. (f) When normalized to the contralateral hemisphere, the mean increase in dorsal hippocampal voxel intensity in the sonicated hemispheres was 56% ± 22% and 33% ± 14% in the 6 and 24 hrs post-FUS groups, respectively (p = 0.123; unpaired, two-tailed, student’s t-test).

