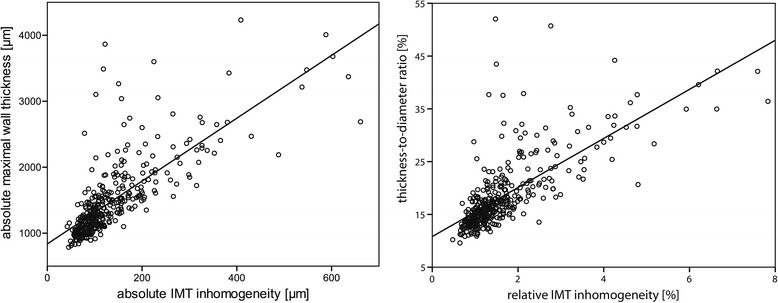
Fig. 2.

Absolute maximal wall thickness as function of absolute IMT inhomogeneity (left) and thickness-to-diameter ratio as function of relative IMT inhomogeneity (right). A strong correlation exists between absolute maximal wall thickness and absolute IMT inhomogeneity (R = 0.76) and between thickness-to-diameter ratio and relative IMT inhomogeneity (R = 0.73)
