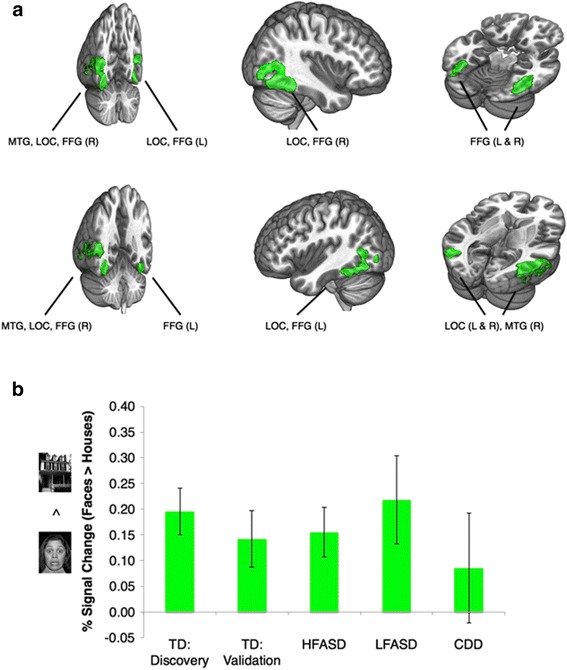
Fig. 4.

Brain regions of interest (ROIs) involved in processing socioemotional (fearful face) versus non-socioemotional (house) visual stimuli. a The green color brain map indicates regions of significant faces > houses activation in a discovery sample of 12 TD subjects (Z > 3.09, whole-brain corrected at the cluster-level P < 0.05). b These independently defined ROIs were then utilized for comparisons across the four remaining cohorts, a TD:validation sample (n = 7), HFASD (n = 14), LFASD (n = 7), and CDD (n = 7). The bar graph indicates the mean % signal change (faces > houses) for each cohort. Group differences were not significant when comparing the TD:validation and HFASD groups [t(19) = 0.17, P = 0.87, Cohen’s d = 0.08] and when comparing the LFASD and CDD groups [t(12) = 0.97, P = 0.35, Cohen’s d = 0.56]. The faces > houses response within the CDD group was not significantly greater than zero [t(6) = 0.80, P = 0.45, Cohen’s d = 0.30]. Error bars indicate standard error of the mean. All P values were calculated by independent t test and are two-tailed. FFG fusiform gyrus, L left, LOC lateral occipital cortex, MTG middle temporal gyrus, R right
