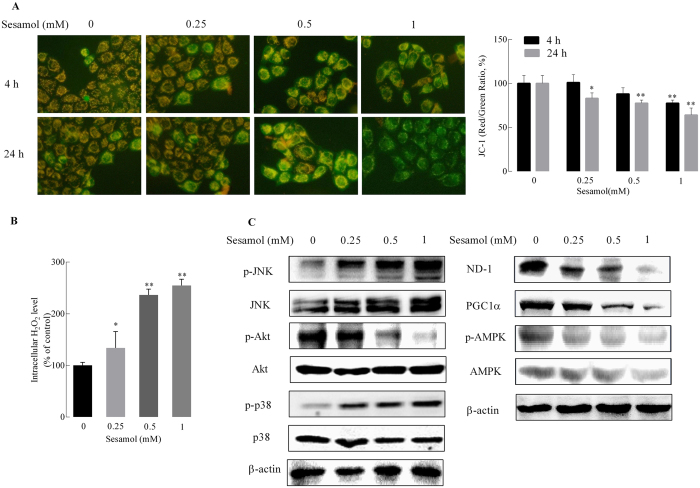
Figure 2. Effects of sesamol on mitochondrial membrane potential and redox-sensitive signaling in HepG2 cells.
Cells were treated with sesamol at the indicated concentrations for 4 or 24 h. After treatment, (A) the cells were detected by a multimode reader after staining with 5 μg/mL JC-1, and were photographed by fluorescence microscopy; the bar graph is the fluorescence intensity which was measured using a multimode microplate reader at 485 nm excitation, 585 nm (red/orange for normal MMP) and 538 nm (green for loss of MMP) emission, respectively. (200 × , magnification). (B) H2O2 production was determined by the Amplex Red Hydrogen Peroxide/Peroxidase Assay, and (C) Left panel is the representative western blots of expressions of redox-sensitive signaling Akt, and MAPK signaling JNK and p38; and the right panel is the representative western blots of expressions of mitochondria complex I subunit ND1 and mitochondrial biogenesis related protein PGC1α, pAMPK/AMPK. Data presented as mean ± SD, n ≥ 6 wells per group, *p < 0.05, **p < 0.01 versus control group.

