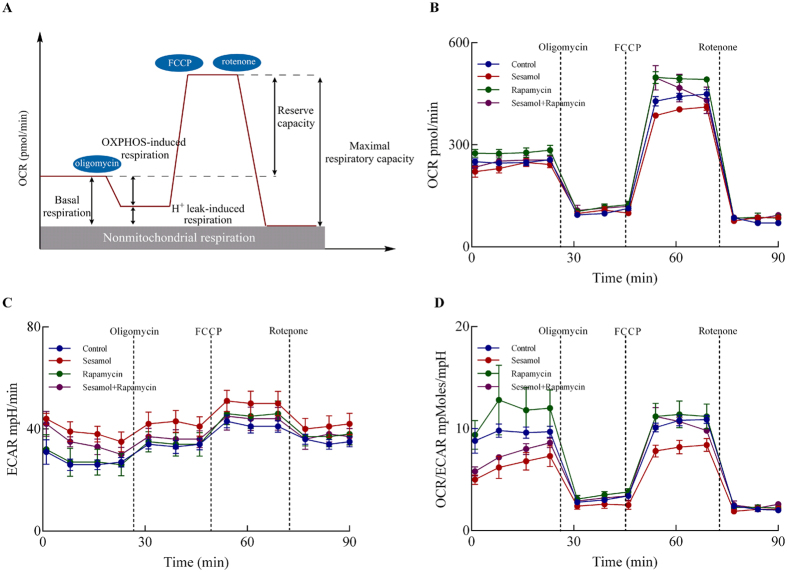
Figure 5. Effects of sesamol on metabolism in HepG2 cells.
(A) Illustration of bioenergetic parameters from energy flux analysis. (B) Time course of oxygen consumption rate (OCR), (C) the extracellular acidification rate (ECAR), and (D) the ratio of OCR and ECAR determined using XF-24 Extraflux analyzer as described under Materials and Methods. Data presented as mean ± SD, n = 5 wells per group, *p < 0.05, **p < 0.01 versus control group.

