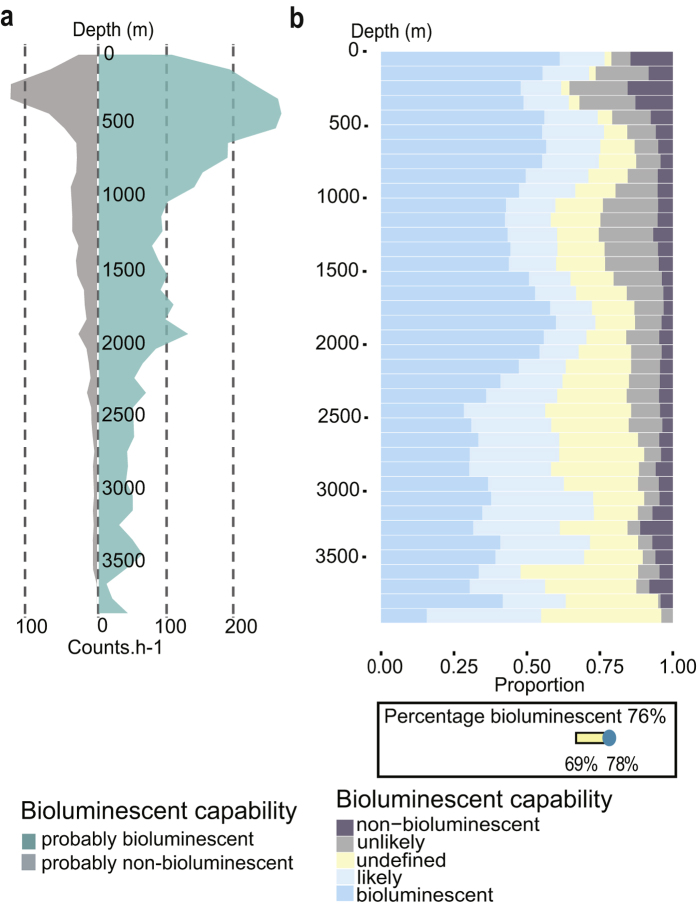
Figure 2. Distribution of bioluminescence capability over depth.
(a) Number of observations (counts per hour) through the water column for probably non-bioluminescent (non-bioluminescent and unlikely) and probably bioluminescent (bioluminescent and likely) organisms. (b) Proportion of bioluminescence capability distributed over depth. In the lower box, the overall percentage of bioluminescent organisms is represented as 76%. The variability of this percentage of bioluminescent capability, depending on the how undefined animals might be assigned, is added on the yellow bar (from 69 to 78%, see text for more details).

