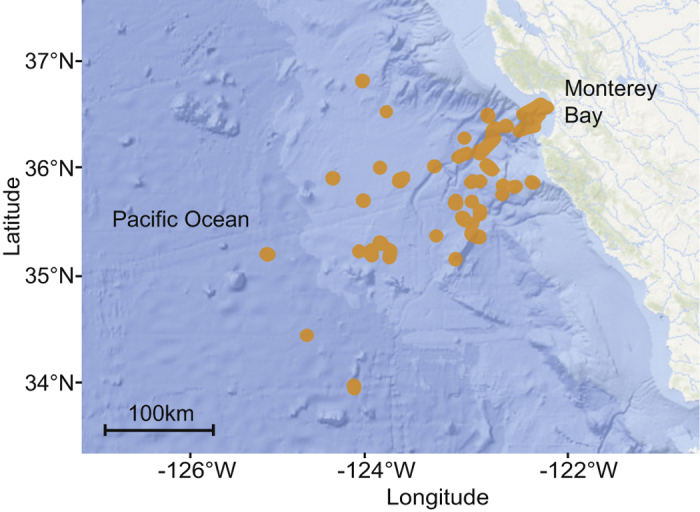
Figure 7. Sampling stations.

Map of the eastern Pacific Ocean and California coast showing the sampling stations (orange dots) from March 1999 to June 2016 in the greater Monterey Bay region. The map is based on NOAA bathymetry (https://maps.ngdc.noaa.gov/viewers/bathymetry/), and sampling stations have been represented using R software47.
