
Fig. 3.
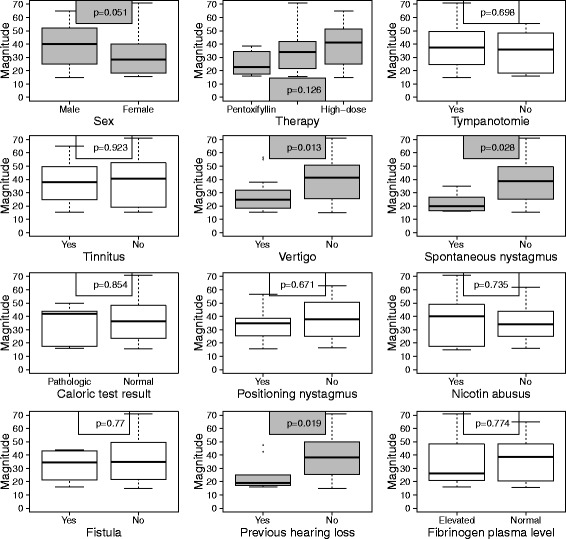
Influence of clinical parameters on the magnitude of a hearing recovery for the subgroup of patients who had a hearing recovery (N = 69, univariate analyses). The upper and the lower boundary of the boxes indicate the 75th and the 25th percentile, respectively. The line within the boxes marks the median. The whiskers below and above the box indicate the 10th and the 90th percentile. In statistical relevant issues the boxes are coloured grey, otherwise blank