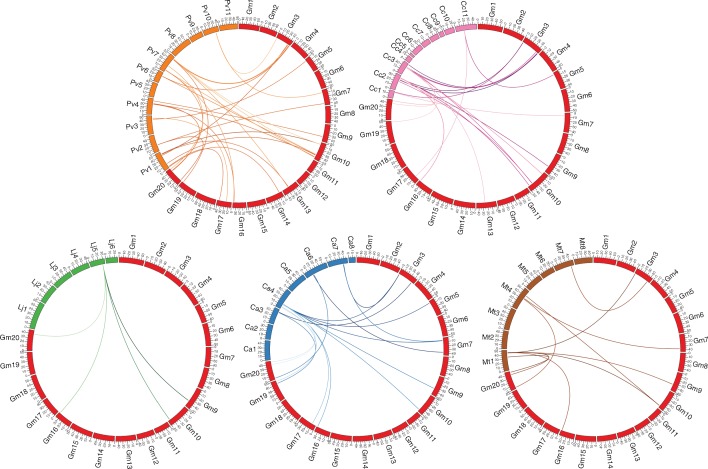
Fig. 4.
Comparative analysis of orthologues of NLL genes between soybean and five legumes. Coloured lines represent orthologues between legume genomes. Bars in different colours represent the chromosomes of the different legumes in a circular way: Gm, G. max; Pv, P. vulgaris; Cc, C. cajan; Lj, L. japonicus; Ca, C. arietinum; Mt, M. truncatula.

