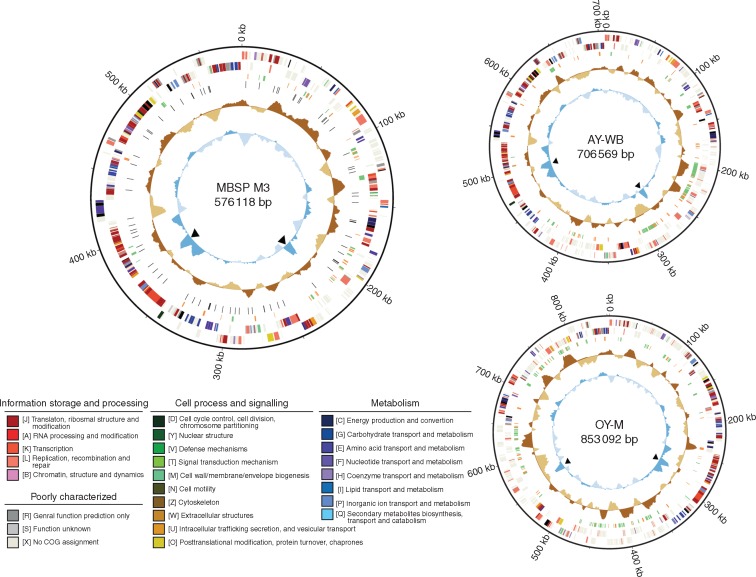
Fig. 4.
Genome maps of the three phytoplasmas belonging to the aster yellows group (16SrI). Concentric circles from the outside in: (1) scale marks, (2 and 3), protein-coding genes on the forward and reverse strand, respectively (color-coded by the functional categories), (4) putative effector (orange) and PMU (green) genes, (5) polymorphic sites among the MBSP strains (not applicable in AY-WB and OY-M), (6) GC skew (positive: dark brown; negative: light brown), and (7) GC content (above average: dark blue; below average: light blue); peaks corresponding to the rRNA gene clusters are highlighted by black triangles.

