
Fig. 1.
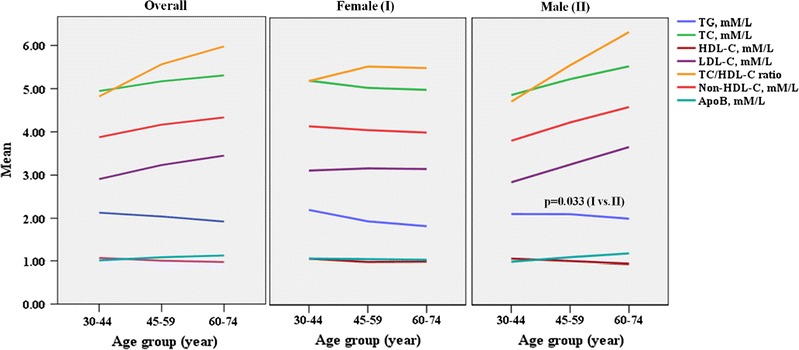
Age- and sex specific mean values of serum lipid parameters and their ratio in diabetic patients. Student's t-test was used to compare the group means of female (I) and male (II) patients. One-way ANOVA was used for comparing serum levels of single lipid parameter within three different age groups (30–44, 45–59 and 60–74). ***p for trend <0.001, **p for trend <0.010 *p for trend <0.05 (two tailed). TG, triglycerides; TC, total cholesterol; HDL-C, high density lipoprotein cholesterol; LDL-C, low density lipoprotein cholesterol; ApoB, apolipoprotein B. Mean refers to the serum mean concentrations and ratio of lipid parameters