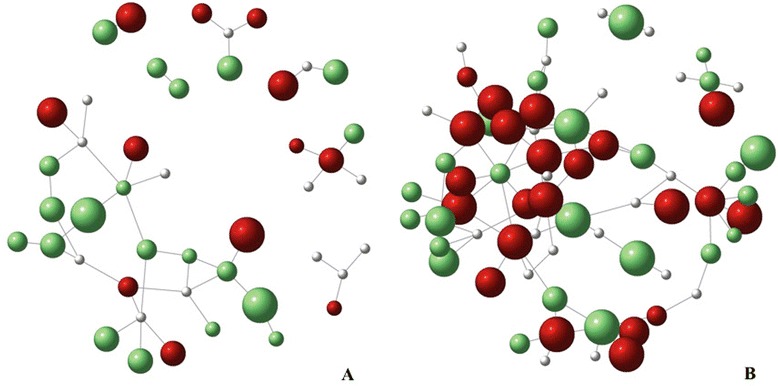
Fig. 3.

Raw-fish-sharing networks of villages 3 and 4. The graphs illustrate the patterns of raw fish sharing among households in village 3 (a) and 4 (b). Red nodes denote O. viverrini-infected households, green nodes denote households with members who tested negative for O. viverrini infection, and white nodes represent missing values. The size of the node reflects the number of raw fish dishes consumed in the household; bigger nodes represent higher raw fish dishes richness
