
Fig. 1.
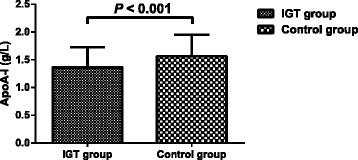
Apolipoprotein A-I (apoA-I) levels measured in the study participants. The values are expressed as the means ± standard deviations. IGT group, patients with impaired glucose tolerance (n = 108); Control group, control subjects (n = 84)
Official websites use .gov
A
.gov website belongs to an official
government organization in the United States.
Secure .gov websites use HTTPS
A lock (
) or https:// means you've safely
connected to the .gov website. Share sensitive
information only on official, secure websites.
Apolipoprotein A-I (apoA-I) levels measured in the study participants. The values are expressed as the means ± standard deviations. IGT group, patients with impaired glucose tolerance (n = 108); Control group, control subjects (n = 84)