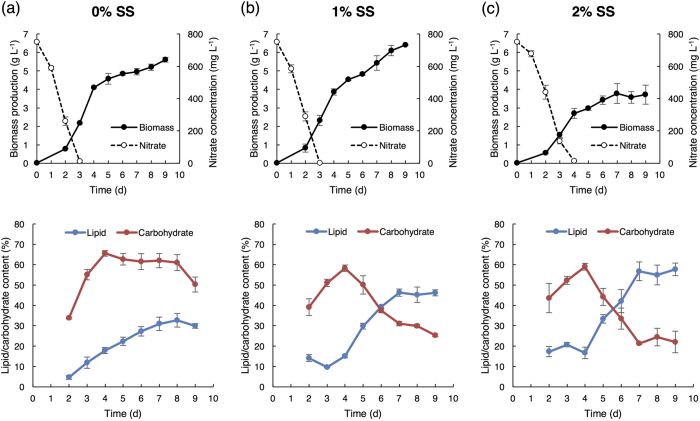
Figure 2. Energy storage compound switched from starch to lipid upon salinity stress.
Time-course profiles of biomass production, nitrate concentration, and lipid and carbohydrate content under (a) 0%, (b) 1%, and (c) 2% of sea salt (SS). Error bars indicate the standard deviation (SD) of three replicate experiments.

