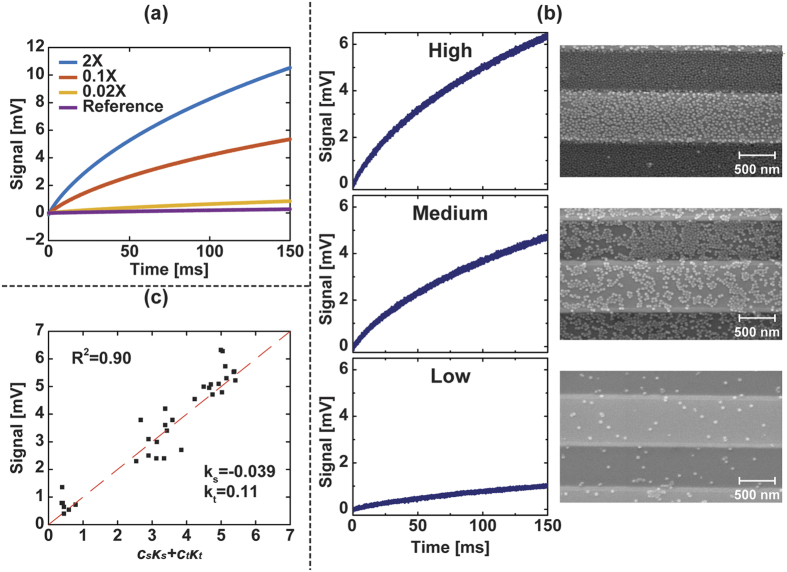
Figure 4.
(a) Average signal under different MNP concentrations. (b) Measured relaxation signals and the corresponding SEM images. The three representative sensors, varied from low to high coverage of MNPs, exhibited high signal dependence over coverage. (c) Extraction of surface coverage showed different signal responses between stripe coverage and trench coverage. The fitted coefficients Cs and Ct are −0.039 and 0.11, respectively.

