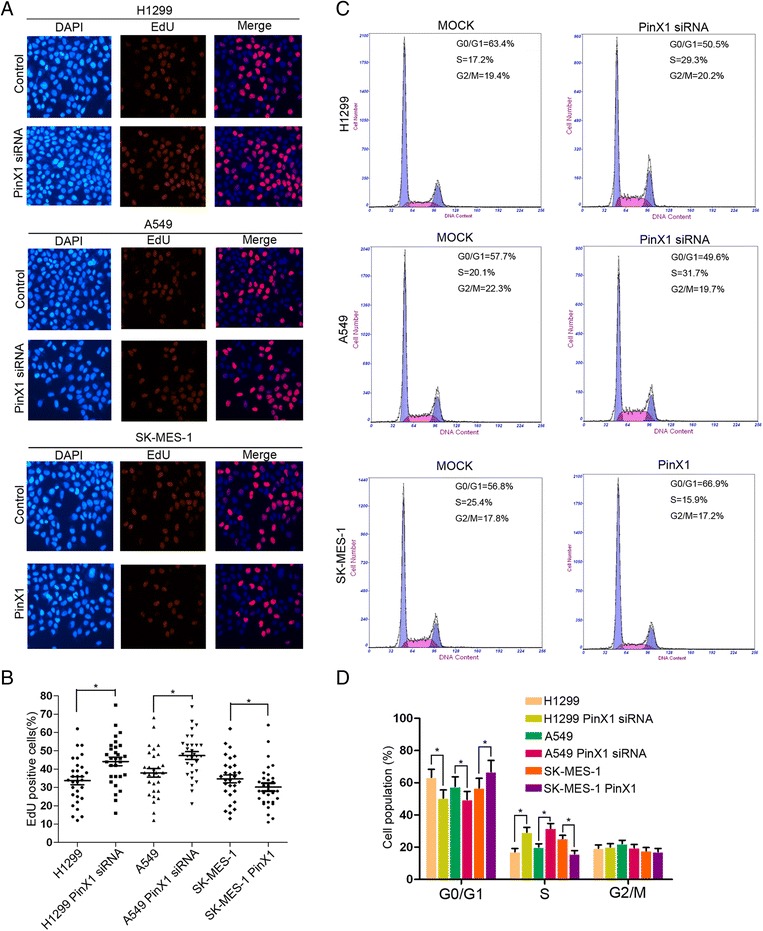
Fig. 4.

PinX1 arrestd G1/S phase transition of the cell cycle. a EdU incorporation assay was used to analyze the population of S phase cells expressing different levels of PinX1. Nuclei were stained with DAPI (blue). S phase cells were stained with EdU (red). Merged images show the percentage of S phase in NSCLC cells. b EdU positive cells were represented using scattergram in NSCLC cells expressing different levels of PinX1. At least 300 total cells from triplicate experiments were counted for each group. *, compared to corresponding control group (P < 0.05). c Cell cycle phases in NSCLC cells expressing different levels of PinX1 were determined by flow cytometry assay. d G1/G0, S, and G2/M phase were plotted in NSCLC cells using histogram. *, compared to corresponding control group (P < 0.05)
