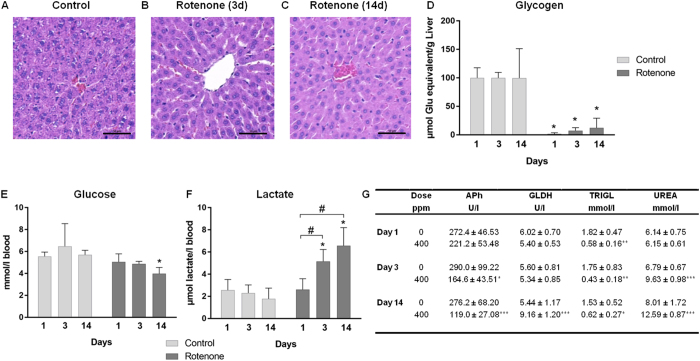
Figure 2. Changes in the liver after rotenone treatment.
(A–C) Histopathological changes in the liver of rats treated with 400 ppm rotenone for 3 (B) and 14 days (C) compared to control (A). Shown are representative hematoxylin and eosin stained liver sections with a scale bar of 50 μm. (D) The enzymatically determined decrease of glycogen content in livers is shown as mean with SD (n = 5) at the three different time-points. (E) Decreased blood glucose, (F) time dependent increased blood lactate concentrations and (G) other significant blood parameters (alkaline phosphatase (APh), glutamate dehydrogenase (GLDH), triglyceride (TRIGL), urea (UREA)) are also presented as mean with SD (n = 5) at the three different time-points. Statistical analysis was performed with Two-Way ANOVA with Sidak multiple comparison test. Statistical significance is indicated by *P < 0.05, **P < 0.01, and ***P < 0.001 compared with time-matched control groups or by #P < 0.05 for the factor “time” of one treatment group.

