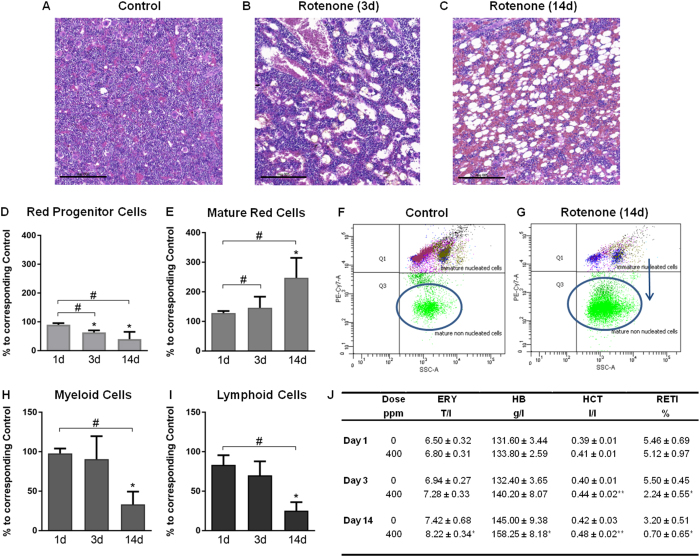
Figure 3. Rotenone effects on hematopoietic tissue.
(A–C) Histopathological changes in the bone marrow of rats treated with 400 ppm rotenone for 3 (B) and 14 days (C) compared to control (A), indicating decreased bone marrow cellularity and an increase in adipocytes after 3 days of treatment (B), with increased severity after 14 days (C). Shown are representative hematoxylin and eosin stained bone marrow sections with a scale bar of 200 μm. (D–G) FACS results of femoral bone marrow, including (D) red progenitor cells, (E) mature red blood cells, (H) myeloid cells and (I) lymphoid cells are shown as percent change (mean with SD, n = 5) at the three different time-points relative to the corresponding time-matched control. (F,G) Representative FACS plots of immature nucleated cells and mature non nucleated cells (blue circle) of a control animal (F) and a rotenone treated animal after 14 days (G). The blue arrow indicates a shift towards more mature erythroid forms. (J) Significantly affected blood cell parameters are presented as mean with SD (n = 5) at the three different time-points. Statistical analysis was performed with Two-Way ANOVA with Sidak multiple comparison test.

