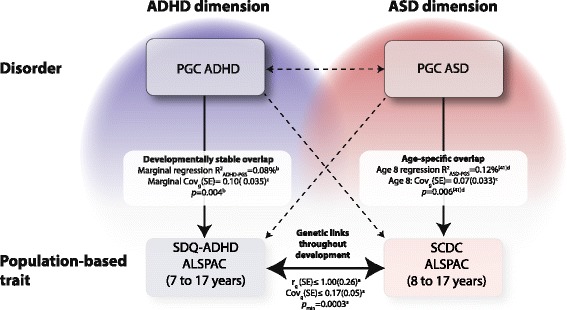
Fig. 4.

Genetic relationships between ASD and ADHD symptoms in clinical and population-based samples (as tagged by common variation). Cross-disorder genetic overlap: The Psychiatric Genomics Consortium (PGC) has previously reported [22] genetic correlations (r g) and covariances (Covg) between PGC-ASD and PGC-ADHD (r g(SE) = −0.13 (0.09), Covg(SE) = −0.026 (0.017), p = 0.13) using genetic-relationship-matrix restricted maximum likelihood (GREML) analyses that provided little evidence for cross-disorder genetic overlap. Cross-trait genetic overlap: Genetic correlations and covariances between standardised SCDC (at 8, 11, 14 and 17 years) and SDQ-ADHD scores (at 7, 10, 12, 13 and 17 years) in ALSPAC, as estimated using bivariate GREML (a), provided evidence for shared genetic links throughout childhood and adolescence (see the ‘Results’ section). Uni-dimensional trait-disorder genetic overlap: The association between SDQ-ADHD scores in ALSPAC and ADHD-PGS (polygenic risk scores (PGS)) was developmentally stable across development, as predicted by linear mixed models (b). A marginal estimate of regression R 2 and a marginal estimate of the expected genetic covariance, as estimated with the Avengeme software (c), are shown (see the ‘Results’ section). As previously reported [41], the association between ASD risk-increasing alleles and SCDC scores in ALSPAC was strongest at age 8 years. Regression R 2 estimates at age 8 years are shown, based on an age-specific analysis using standardised scores and linear regression models (d) [41]. The expected genetic covariance was estimated with Avengeme software (c) (Covg(95% CI) = 0.072 (0.0082,0.14) (approximated SE = 0.033)). Cross-dimensional trait-disorder genetic overlap: There was little support for association between ASD-PGS and SDQ-ADHD or association between ADHD-PGS and SCDC scores in ALSPAC (see the ‘Results’ section, p > experiment-wise error rate p = 0.01). All polygenic scoring analyses are shown for a PGS threshold (P T) of 0.5. Genetic relationships reaching statistical significance are shown as solid lines and as dashed lines otherwise. Previous reports based on linkage disequilibrium score genetic correlations [23, 28] are omitted for clarity. ADHD attention deficit hyperactivity disorder, ALSPAC Avon Longitudinal Study of Parents and Children, ASD autism spectrum disorder, PGC-ADHD ADHD collection of the PGC, PGC-ASD ASD collection of the PGC, SCDC Social and Communication Disorders Checklist, SDQ-ADHD ADHD subscale of the Strength and Difficulties Questionnaire
