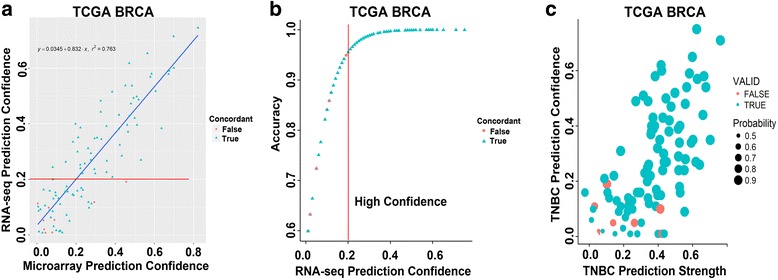
Fig. 1.

TNBC molecular subtype concordance between matched FF and FFPE samples processed on microarray and RNA-seq improves with increased prediction confidence. a Scatterplot shows TNBC subtype accuracy between microarray and RNA-seq as a function of prediction confidence in the TCGA breast (BRCA) cohort. b Plot shows RNA-seq prediction accuracy by confidence score. Vertical line cutoff demarks the prediction confidence score generating 95% concordance between platforms. c Scatterplot shows the concordance between microarray and RNA-seq platforms by strength of correlation to a subtype (prediction score)
