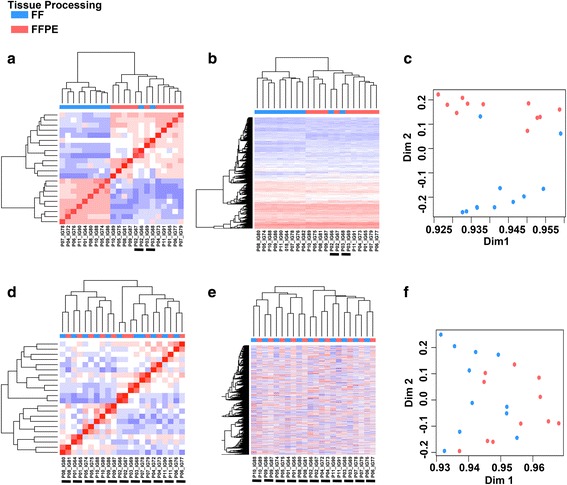
Fig. 4.

Removal of differential transcripts improves FF and FFPE gene expression correlation. Heatmaps display unsupervised hierarchical clustering of a sample-wise correlation coefficients, b all transcripts (n = 27,577) or c principal component analysis (PCA) of all transcripts. Following removal of differentially expressed transcripts between FF and FFPE samples, remaining transcripts (n = 15,624) were used to perform d sample-wise correlation coefficients e hierarchical clustering or f PCA. Underlined samples indicate clustering of paired FF and FFPE samples
