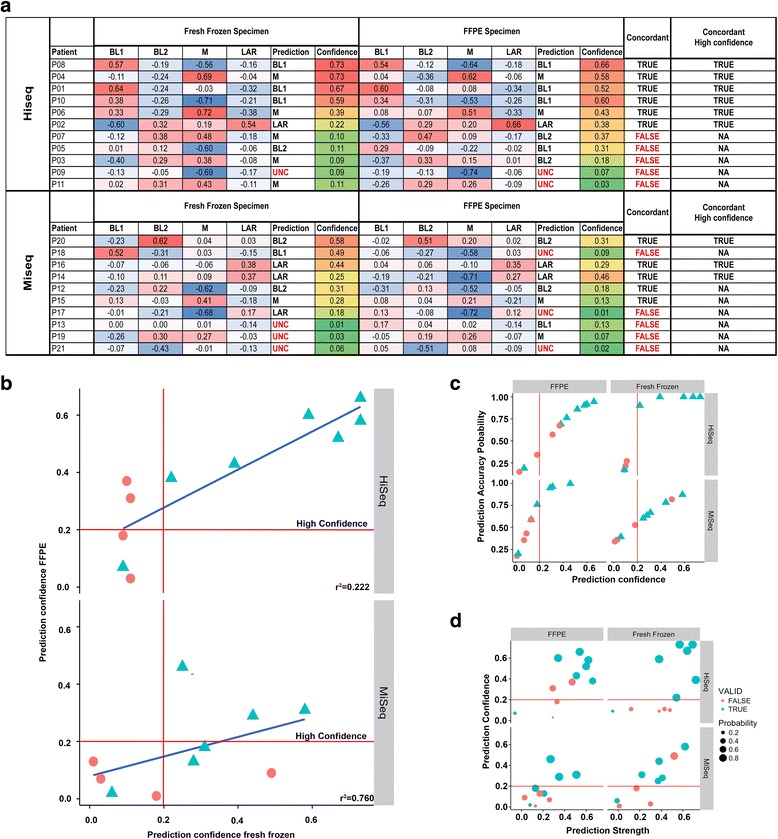
Fig. 6.

Accuracy of TNBC subtype calls between FF and FFPE depends on prediction confidence and sequencing depth. a Table summarizes TNBC subtype correlations, prediction calls, prediction confidence and concordance between matched FF and FFPE samples processed on the Illumina HiSeq and MiSeq. b Scatter plots show concordance (blue) between FF and FFPE samples run on HiSeq and MiSeq as a function of prediction confidence. c Scatterplots show the prediction confidence and prediction accuracy for FFPE (left) or FF (right) samples processed on the HiSeq (top) or MiSeq (bottom). d Scatter plots show prediction confidence and prediction strength for FFPE and FF samples processed on the HiSeq and MiSeq. Those samples with concordant subtype calls are indicated in blue and discordant calls in red
