
Figure 2. The phonon spectra of borophene along several high symmetry directions.
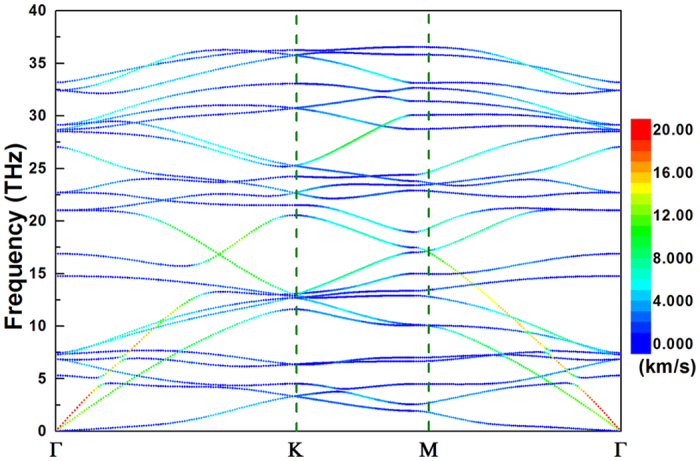
The magnitude of group velocity of each phonon modes is projected to the corresponding phonon branches, which is denoted by the different color.
Official websites use .gov
A
.gov website belongs to an official
government organization in the United States.
Secure .gov websites use HTTPS
A lock (
) or https:// means you've safely
connected to the .gov website. Share sensitive
information only on official, secure websites.
The magnitude of group velocity of each phonon modes is projected to the corresponding phonon branches, which is denoted by the different color.