Fig. 2.

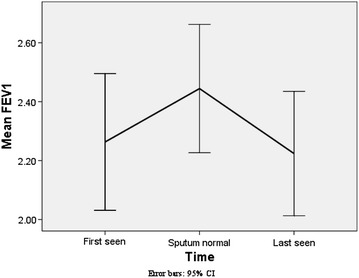
Mean FEV1 (with 95% CI) at three time points (when first seen, when sputum became normal, when last seen). Asterisk rates of decline are for the average age and height for the respective group

Mean FEV1 (with 95% CI) at three time points (when first seen, when sputum became normal, when last seen). Asterisk rates of decline are for the average age and height for the respective group