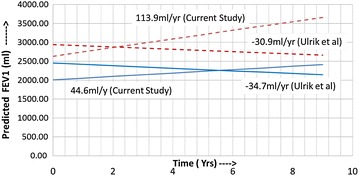
Fig. 3.

Comparison of predicted (calculated) FEV1 vs time in years (Current Study vs Ulrik et al.). Dotted lines males, solid line females; predicted rates of decline and FEV1 for both studies are for the mean age (males 52.4 years, females 49.8 years) and mean height (males 173.2 cm, females 161.4 cm) of the current study population. Equations for current study: FEV1 at time t for males = (2.6795 − 0.03808*AGE +0.01124*HT) +(1.05455 − 0.00646*AGE −0.00348*HT)t; FEV1 at time t for females = (−4.27125 − 0.0253*AGE +0.04674*HT) + (−2.71234 − 0.00336*AGE +0.01812*HT)t. Equations for Ulrik et al.: FEV1 at time t for males = (−469 − 35.2*AGE +32.0*HT) − (−107 − 0.79*AGE +0.6*HT + 1.7)t; FEV1 at time t for females = (−410 − 27.6*AGE +21.2*HT) − (−107 − 0.79*AGE +0.6*HT + 3)t
