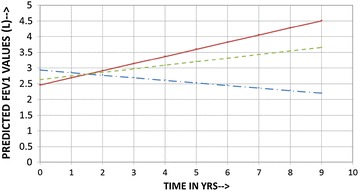
Fig. 4.

Predicted (calculated) FEV1 vs time in years for males (Baseline to last seen) showing no statistical difference between smokers and nonsmokers; dashed line all patients, solid line smokers, dash and dot line nonsmokers. Predicted rates of decline and FEV1 are for the mean age and mean height for the respective group of the current study population
