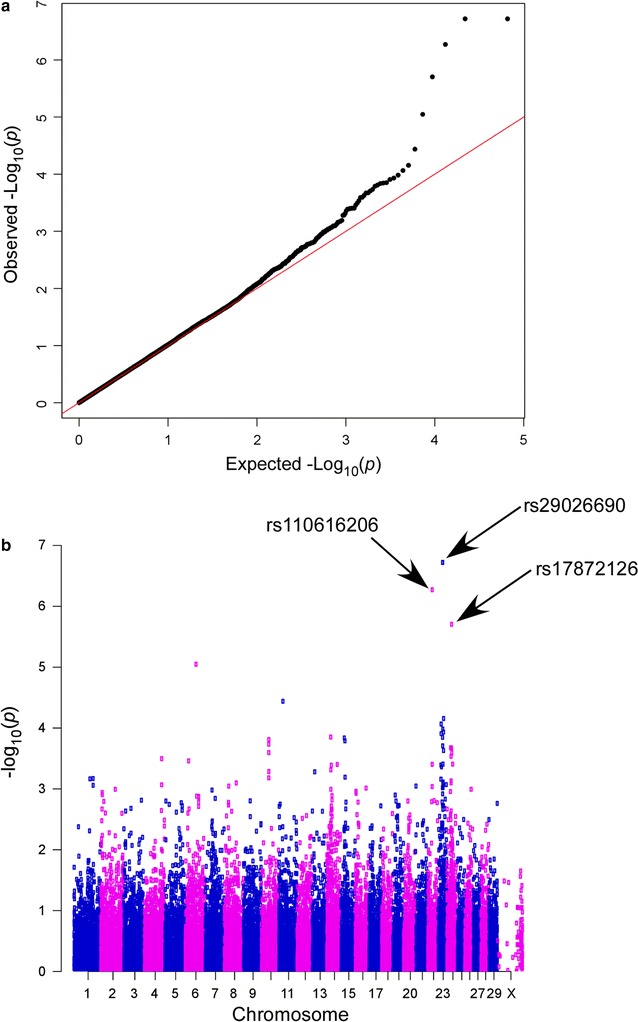
Fig. 2.

Three-hundred and fifty-nine BLV-infected cows were genotyped using a BovineSNP50 DNA Analysis BeadChip (Illumina Inc., San Diego, CA), and SNPs associated with the BLV proviral load were examined. a Quantile–quantile (Q–Q) plot. The observed distribution of the −log10 nominal p values (y-axis) demonstrates a significant departure from the null hypothesis (expected values are shown on the x-axis) (λGC = 1.021). Red line represents the line as y = x. b Manhattan plot showing the association between 33,006 SNPs (BovineSNP BeadChip) and the BLV proviral load in DNA samples from 359 Japanese Black cattle. The chromosomes are denoted by different colors (blue odd numbers; orange even numbers). The chromosome number is indicated on the x-axis. The blue line represents the Bonferroni-corrected threshold for genome-wide significance (−log10(p) = 5.82)
