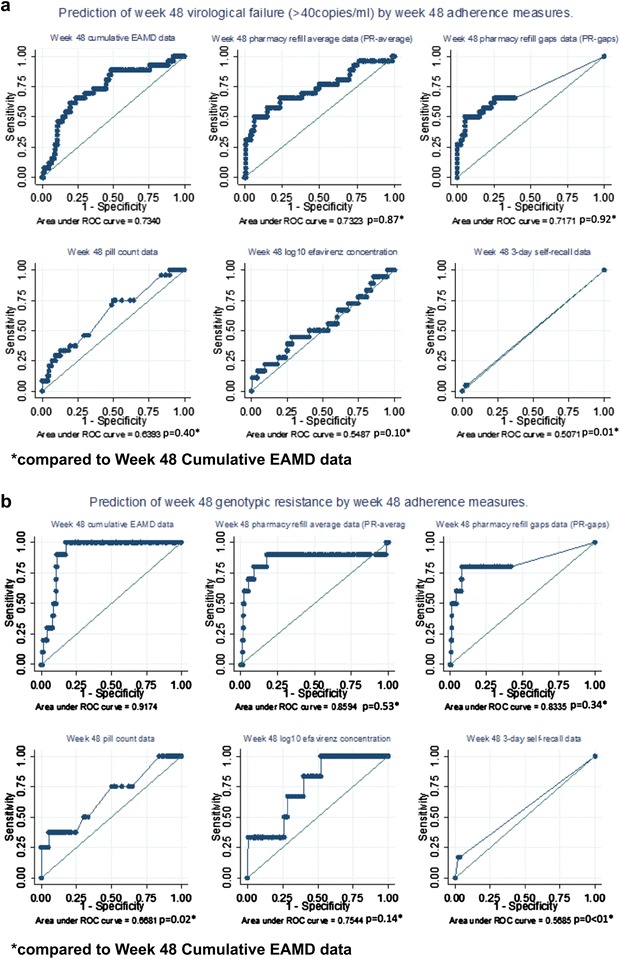
Fig. 2.

Prediction of virological failure or resistance by each adherence measure at week 48. Receiver operating characteristic (ROC) curves showing prediction of virological failure (>40 copies/ml) and resistance at week 48 by six adherence measures. Univariate model data are shown. a Prediction of virological failure to <40 copies/ml at week 48 using adherence measures at week 48. b Prediction of resistance at week 48 using adherence measures at week 48. *Compared to week 48 cumulative EAMD data
