
Fig. 2.
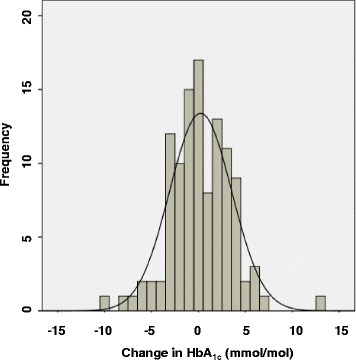
Histogram demonstrating the difference in HbA1c levels between initial and repeat test (Repeat minus the initial HbA1c level) in those initially identified as having HbA1c ≥ 42 mmol/mol
Official websites use .gov
A
.gov website belongs to an official
government organization in the United States.
Secure .gov websites use HTTPS
A lock (
) or https:// means you've safely
connected to the .gov website. Share sensitive
information only on official, secure websites.
Histogram demonstrating the difference in HbA1c levels between initial and repeat test (Repeat minus the initial HbA1c level) in those initially identified as having HbA1c ≥ 42 mmol/mol