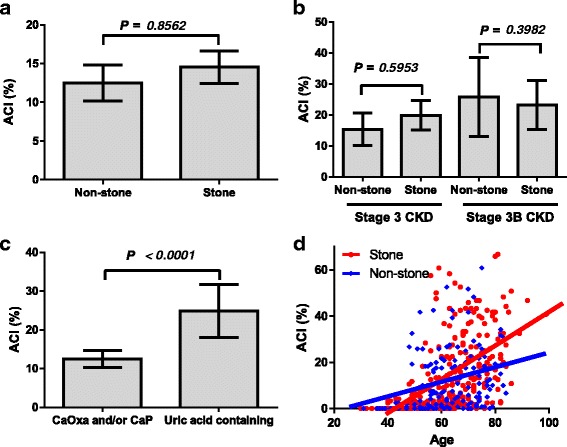
Fig. 2.

Aortic calcification index (ACI) between control subjects and stone patients. ACI was not significantly different between the Non-stone and Stone groups (a). In the stage 3 or 3B CKD patients, there are no significant differences in ACI between the groups (b). ACI was significantly higher in uric acid containing stone patients (c). Scatter plot analyses are performed to compare the relationship between aortic calcification index (ACI) and age. Linear approximations of ACI and age show a positive correlation in the Non-stone (blue line, R2 = 0.071, P <0.001) and Stone group (red line, R2 = 0.285, P < 0.001) (Spearman’s correlation coefficient test). Age-adjusted ACI (a slope of line) is greater in the Stone group (0.744) compared with the Non-stone group (0.468) (d)
